Plot histogram
Usage
plot_histogram(
  data,
  binwidth = 0.01,
  show_border = FALSE,
  border_color = "black",
  alpha = 1,
  theme = "viridis",
  theme_begin = 0,
  theme_end = 0.5,
  theme_direction = -1,
  legend_position = "right"
)
Arguments
- data
A numeric vector.
- binwidth
Width of the bins.
- show_border
Logical value, whether to show border of the bins.
- border_color
Color of the border.
- alpha
Alpha value of the bins.
- theme
Theme of the bins.
- theme_begin
Begin value of the theme.
- theme_end
End value of the theme.
- theme_direction
Direction of the theme.
- legend_position
The position of legend.
Examples
data(example_matrix)
network_table <- inferCSN(example_matrix)
#> ℹ [2026-01-23 02:16:06] Inferring network for <matrix/array>...
#> ◌ [2026-01-23 02:16:06] Checking parameters...
#> ℹ [2026-01-23 02:16:06] Using L0 sparse regression model
#> ℹ [2026-01-23 02:16:06] Using 1 core
#> ⠙ [2026-01-23 02:16:06] Running for g1 [1/18] ■■■ …
#> ✔ [2026-01-23 02:16:06] Completed 18 tasks in 182ms
#>
#> ℹ [2026-01-23 02:16:06] Building results
#> ✔ [2026-01-23 02:16:07] Inferring network done
#> ℹ [2026-01-23 02:16:07] Network information:
#> ℹ Edges Regulators Targets
#> ℹ 1 306 18 18
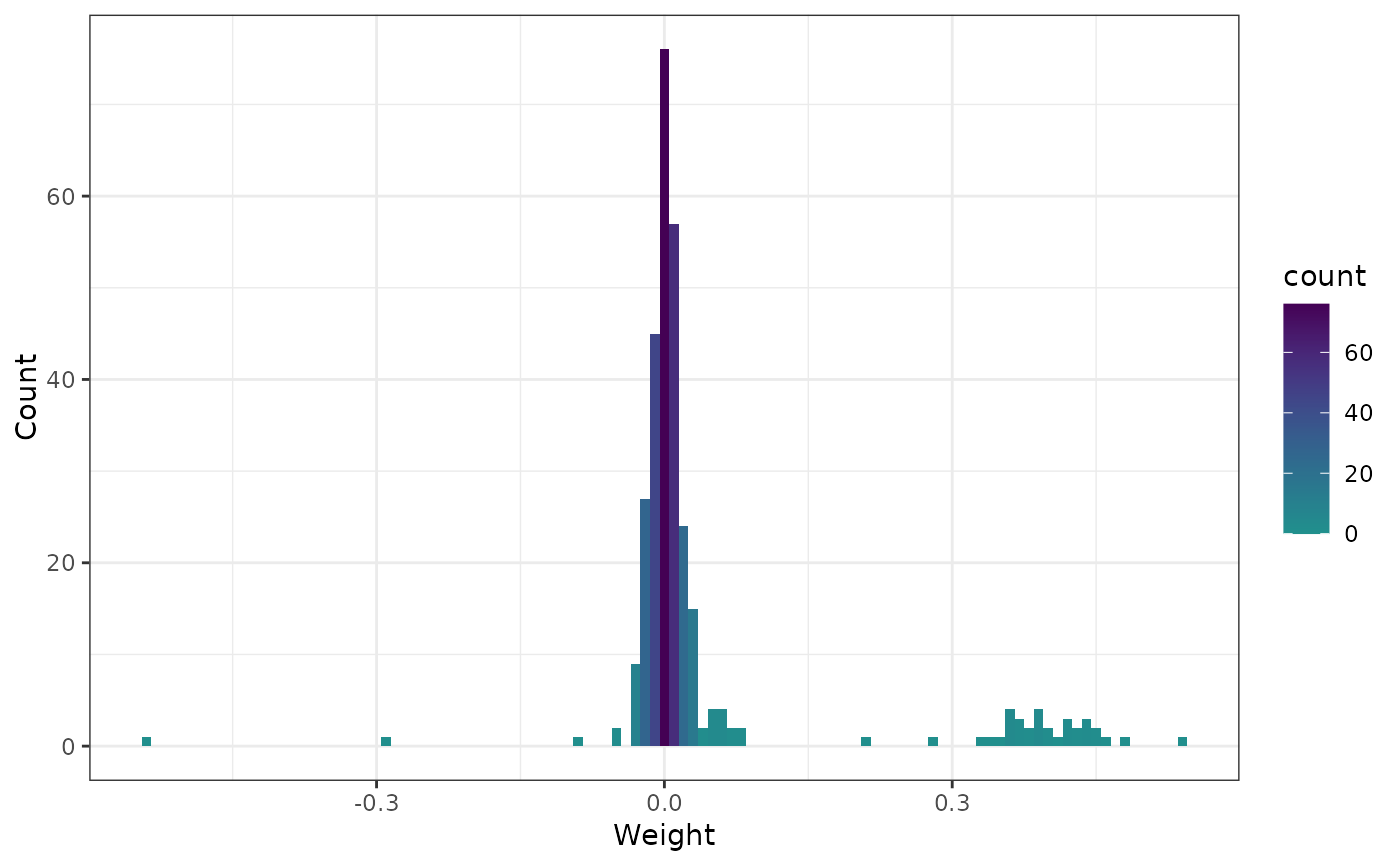
plot_histogram(network_table[, 3])
#> Warning: The `size` argument of `element_line()` is deprecated as of ggplot2 3.4.0.
#> ℹ Please use the `linewidth` argument instead.
#> ℹ The deprecated feature was likely used in the inferCSN package.
#> Please report the issue at <https://github.com/mengxu98/inferCSN/issues>.