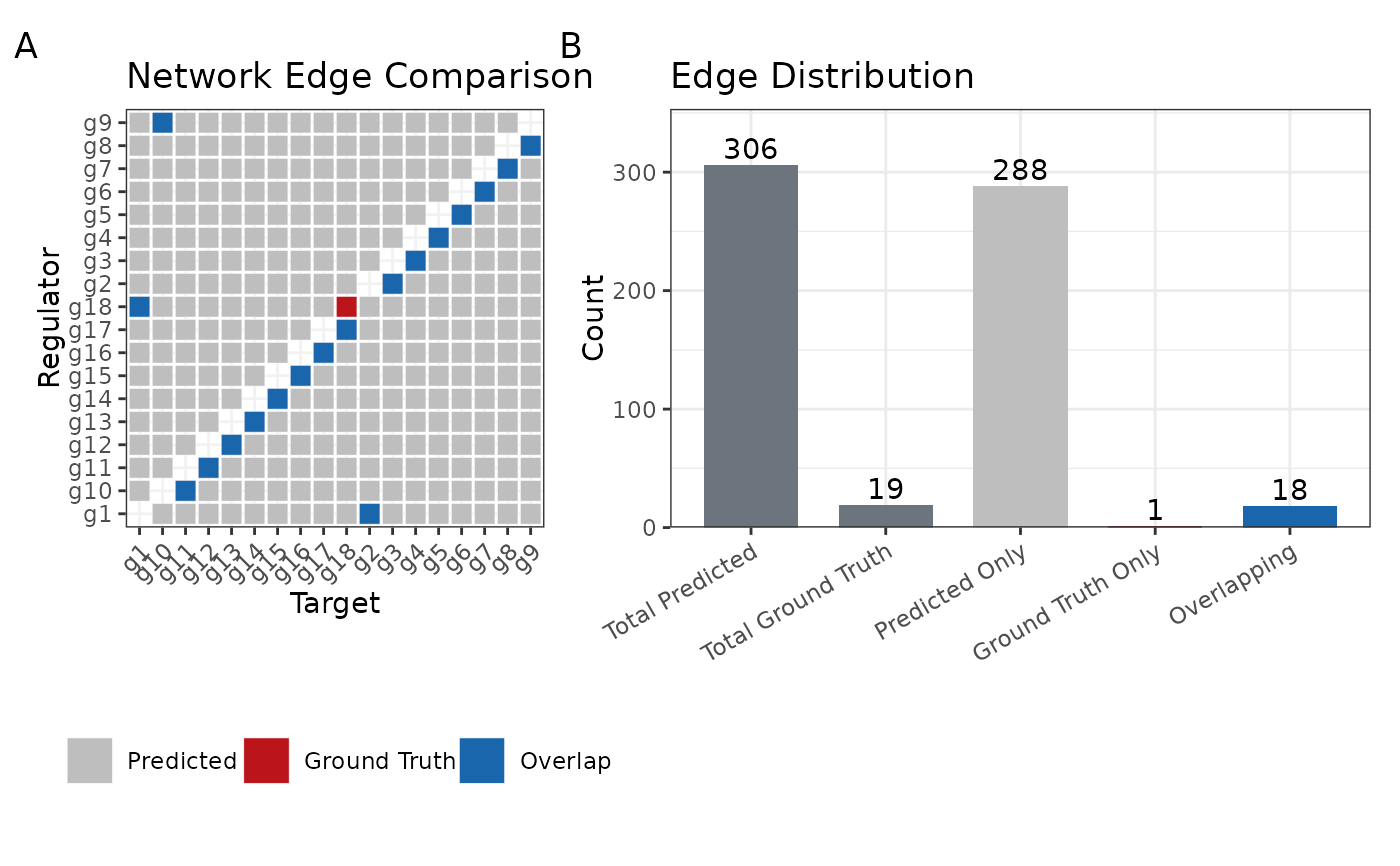
Generates visualizations comparing edges of two networks.
Usage
plot_edges_comparison(
  network_table,
  ground_truth,
  color_pattern = list(predicted = "gray", ground_truth = "#bb141a", overlap = "#1966ad",
    total = "#6C757D")
)Examples
data(example_matrix)
data("example_ground_truth")
network_table <- inferCSN(example_matrix)
#> ℹ [2026-01-23 02:16:04] Inferring network for <matrix/array>...
#> ◌ [2026-01-23 02:16:04] Checking parameters...
#> ℹ [2026-01-23 02:16:04] Using L0 sparse regression model
#> ℹ [2026-01-23 02:16:04] Using 1 core
#> ℹ [2026-01-23 02:16:04] Building results
#> ✔ [2026-01-23 02:16:04] Inferring network done
#> ℹ [2026-01-23 02:16:04] Network information:
#> ℹ                         Edges Regulators Targets
#> ℹ                       1   306         18      18
plot_edges_comparison(
  network_table,
  example_ground_truth
)