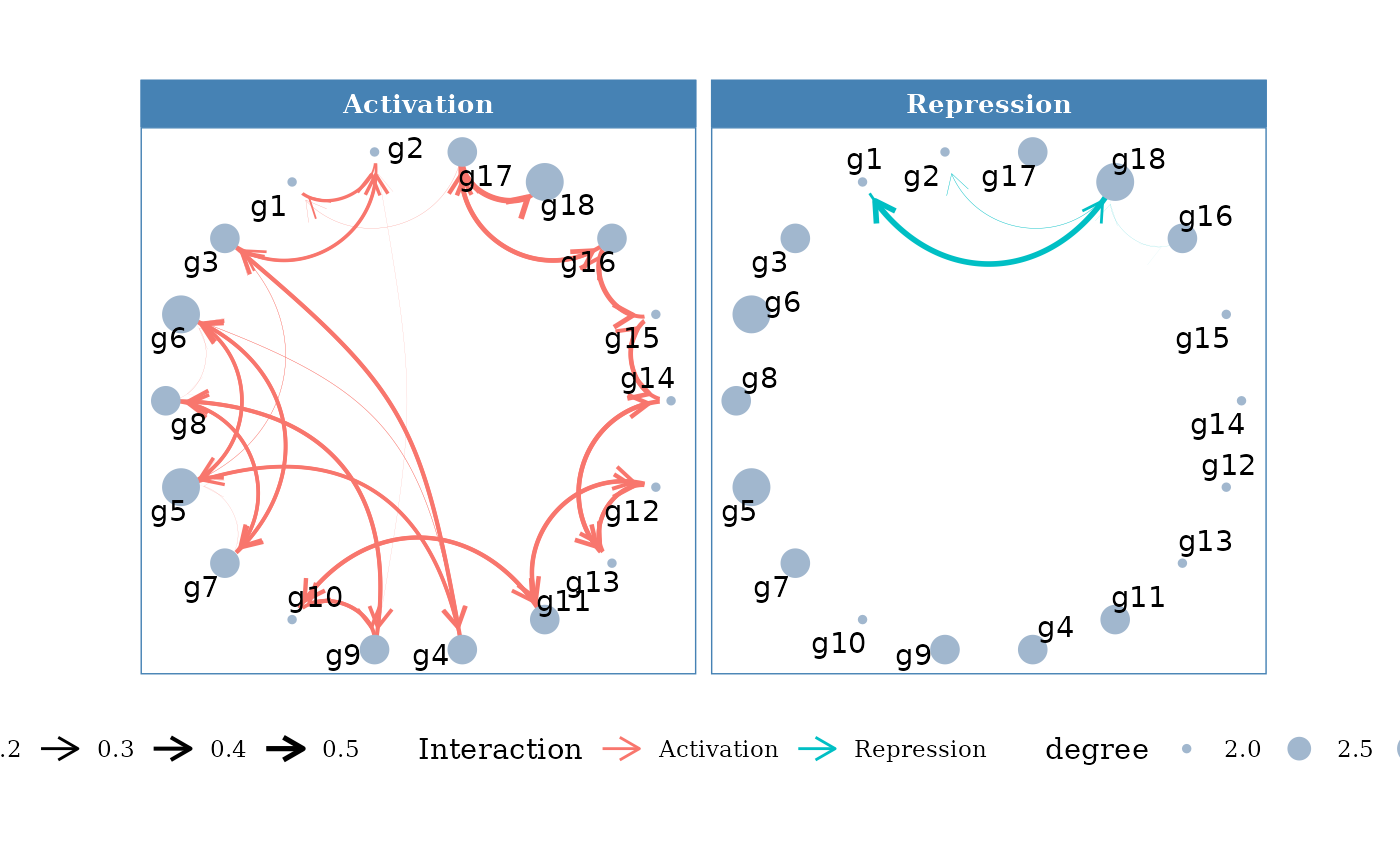
Plot contrast networks
Usage
plot_contrast_networks(
  network_table,
  degree_value = 0,
  weight_value = 0,
  legend_position = "bottom"
)Examples
data(example_matrix)
network_table <- inferCSN(example_matrix)
#> ℹ [2026-01-23 02:16:00] Inferring network for <matrix/array>...
#> ◌ [2026-01-23 02:16:00] Checking parameters...
#> ℹ [2026-01-23 02:16:00] Using L0 sparse regression model
#> ℹ [2026-01-23 02:16:00] Using 1 core
#> ℹ [2026-01-23 02:16:00] Building results
#> ✔ [2026-01-23 02:16:00] Inferring network done
#> ℹ [2026-01-23 02:16:00] Network information:
#> ℹ                         Edges Regulators Targets
#> ℹ                       1   306         18      18
plot_contrast_networks(network_table[1:50, ])