Calculate Network Prediction Performance Metrics
Source:R/network_evaluation.R
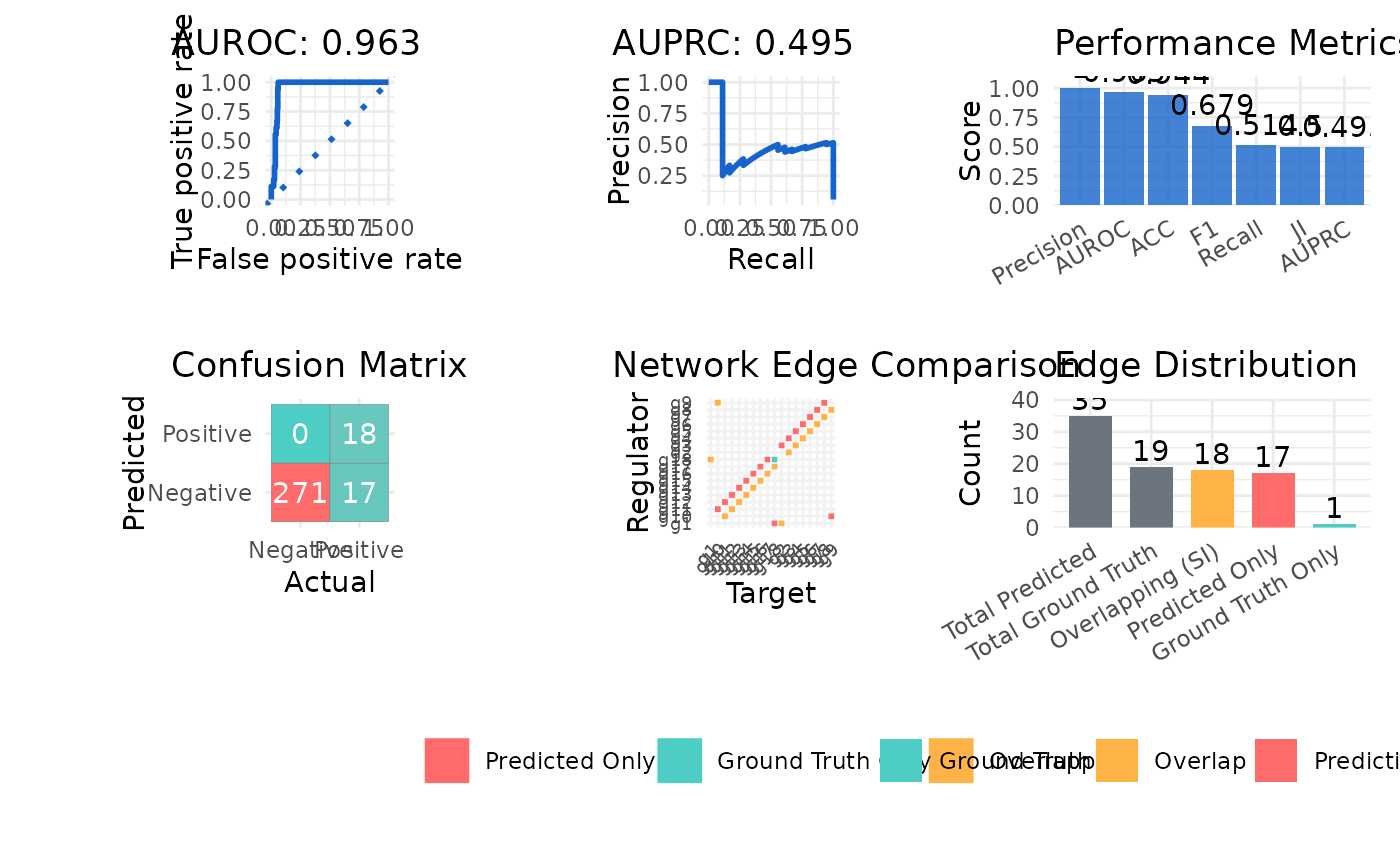
calculate_metrics.RdCalculates comprehensive performance metrics for evaluating predicted network structures, including classification performance, precision-recall metrics, and network topology metrics.
Usage
calculate_metrics(
  network_table,
  ground_truth,
  metric_type = c("all", "auc", "auroc", "auprc", "precision", "recall", "f1",
    "accuracy", "si", "ji"),
  return_plot = FALSE,
  line_color = "#1563cc",
  line_width = 1
)
Arguments
- network_table
A data frame.
- ground_truth
A data frame of ground truth network with the same format as network_table.
- metric_type
The type of metric to return. Default is
"all". This can take any of the following choices:all Returns all available metrics with Performance Metrics plot.
auc Returns both AUROC and AUPRC with their plots.
auroc Area Under ROC Curve with plot.
auprc Area Under Precision-Recall Curve with plot.
precision Proportion of correct predictions among positive predictions.
recall Proportion of actual positives correctly identified.
f1 Harmonic mean of precision and recall.
accuracy Overall classification accuracy.
si Set Intersection, counting correctly predicted edges.
ji Jaccard Index, measuring overlap between predicted and true networks.
- return_plot
Whether to generate visualization plots. Default is
FALSE.- line_color
Color for plot lines. Default is
#1563cc.- line_width
Width for plot lines. Default is
1.
Value
A list containing:
metrics A data frame with requested metrics.
plot A plot object if return_plot = TRUE (optional).
Examples
data(example_matrix)
data("example_ground_truth")
network_table <- inferCSN(example_matrix)
#> ℹ [2026-01-23 02:15:53] Inferring network for <matrix/array>...
#> ◌ [2026-01-23 02:15:53] Checking parameters...
#> ℹ [2026-01-23 02:15:53] Using L0 sparse regression model
#> ℹ [2026-01-23 02:15:53] Using 1 core
#> ℹ [2026-01-23 02:15:53] Building results
#> ✔ [2026-01-23 02:15:54] Inferring network done
#> ℹ [2026-01-23 02:15:54] Network information:
#> ℹ                         Edges Regulators Targets
#> ℹ                       1   306         18      18
calculate_metrics(
  network_table,
  example_ground_truth,
  return_plot = TRUE
)
#> $metrics
#>      Metric  Value
#> 1     AUROC  0.952
#> 2     AUPRC  0.437
#> 3 Precision  0.529
#> 4    Recall  1.000
#> 5        F1  0.692
#> 6       ACC  0.948
#> 7        JI  0.514
#> 8        SI 18.000
#>
#> $plot

#>
calculate_metrics(
  network_table,
  example_ground_truth,
  metric_type = "auroc"
)
#> $metrics
#>   Metric Value
#> 1  AUROC 0.952
#>
#>
calculate_metrics(
network_table,
example_ground_truth,
metric_type = "auroc"
)
#> $metrics
#> Metric Value
#> 1 AUROC 0.952
#>