Calculates AUPRC metric with optional visualization
Usage
calculate_auprc(
  network_table,
  ground_truth,
  return_plot = FALSE,
  line_color = "#1563cc",
  line_width = 1
)Examples
data(example_matrix)
data("example_ground_truth")
network_table <- inferCSN(example_matrix)
#> ℹ [2026-01-23 02:15:51] Inferring network for <matrix/array>...
#> ◌ [2026-01-23 02:15:51] Checking parameters...
#> ℹ [2026-01-23 02:15:51] Using L0 sparse regression model
#> ℹ [2026-01-23 02:15:51] Using 1 core
#> ℹ [2026-01-23 02:15:51] Building results
#> ✔ [2026-01-23 02:15:51] Inferring network done
#> ℹ [2026-01-23 02:15:51] Network information:
#> ℹ Edges Regulators Targets
#> ℹ 1 306 18 18
calculate_auprc(
network_table,
example_ground_truth,
return_plot = TRUE
)
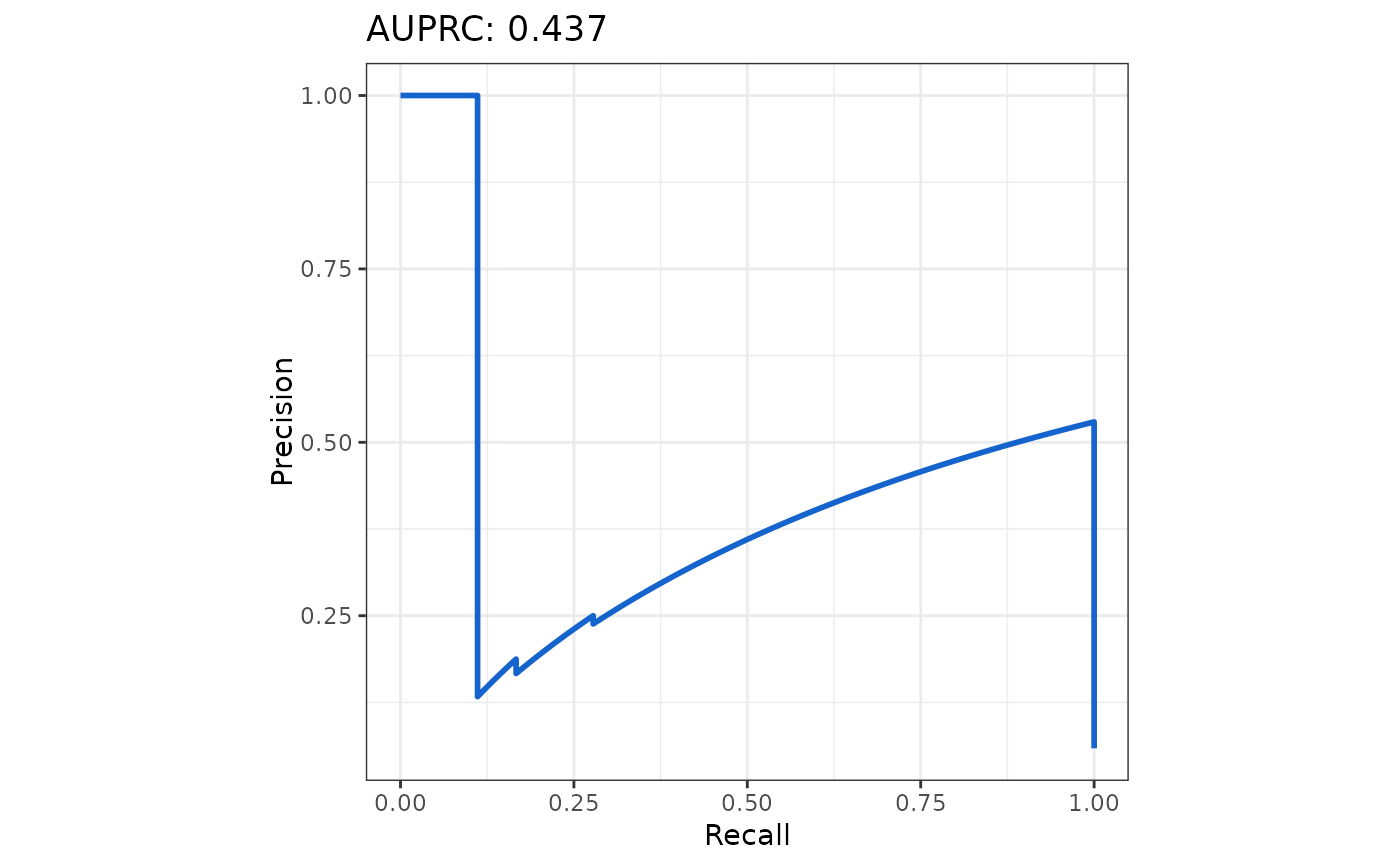
#> $metrics
#> Metric Value
#> 1 AUPRC 0.437
#>
#> $plot
 #>
#>