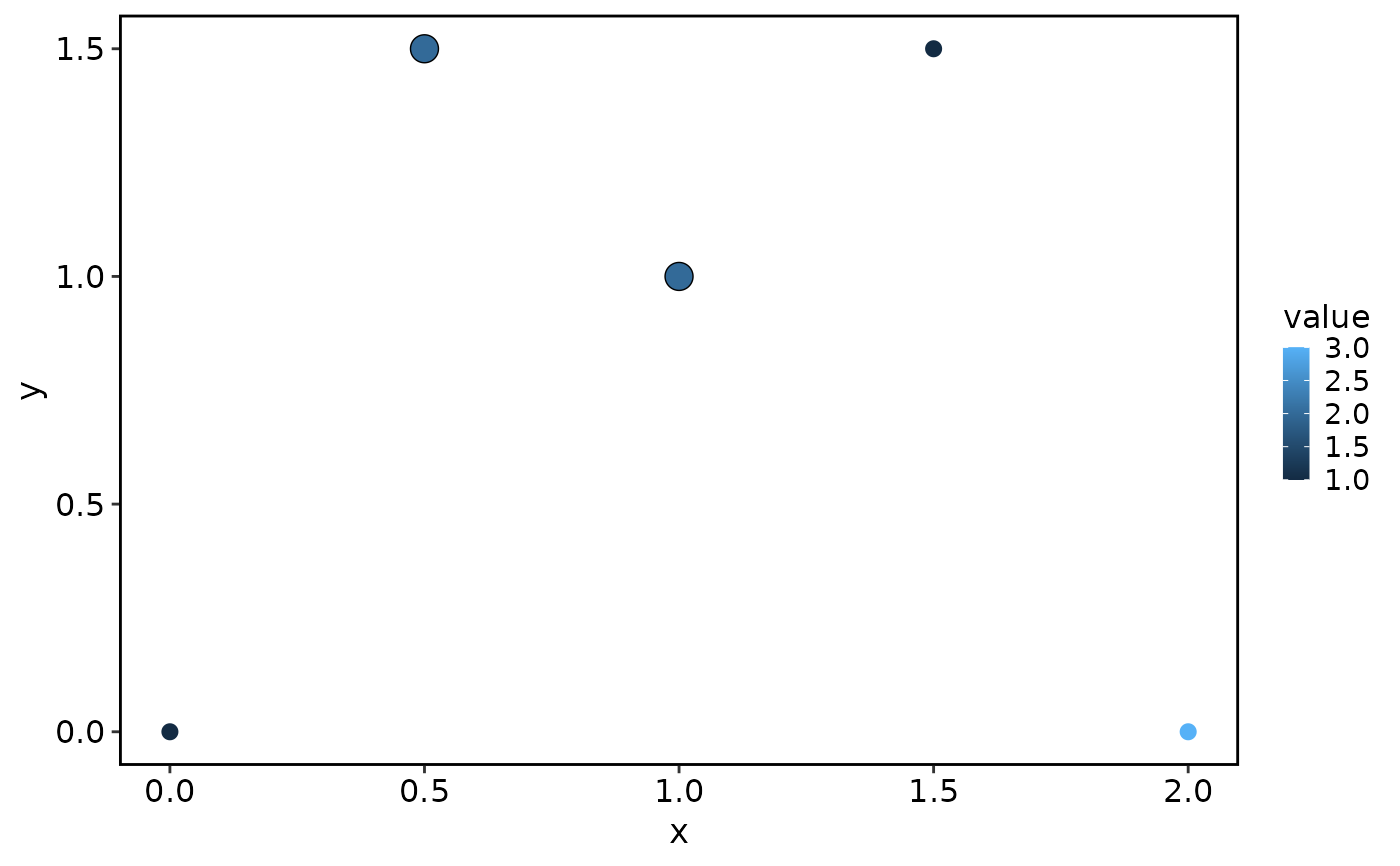
Draw vector or raster points with optional outlines.
Usage
scatter_layers(
  data = NULL,
  mapping = NULL,
  pt.size = 1,
  pt.alpha = 1,
  raster = FALSE,
  raster.pt.size = pt.size,
  raster.dpi = c(512, 512),
  color = NULL,
  stroke = 0,
  outline = FALSE,
  outline.color = "black",
  outline.stroke = 0.5
)
Arguments
- data
A data frame, or
NULLto inherit the plot data.- mapping
A ggplot2 aesthetic mapping containing x and y coordinates and optional point colours. Defaults to
NULLto inherit the plot mapping.- pt.size
Numeric vector point size. Default
1.- pt.alpha
Numeric point transparency. Default
1.- raster
Whether to use scattermore raster points. Default
FALSE.- raster.pt.size
Numeric raster point size in pixels. Defaults to
pt.size.- raster.dpi
Two positive finite raster dimensions, or
NULL. Defaultc(512, 512).- color
Optional fixed point colour. Omit it to retain mapped colours.
- stroke
Numeric vector point stroke width. Default
0;NULLuses the ggplot2 default.- outline
Whether to draw a larger point beneath each foreground point. Default
FALSE.- outline.color
Outline point colour. Default
"black".- outline.stroke
Extra size added to outline points. Default
0.5.
Value
A list containing one ggplot2 point layer, or two layers when
outline = TRUE. Add the list to a ggplot with +.
Examples
observations <- data.frame(
  x = c(0, 1, 2, 0.5, 1.5), y = c(0, 1, 0, 1.5, 1.5),
  value = c(1, 2, 3, 2, 1)
)
ggplot2::ggplot(observations) +
  scatter_layers(mapping = ggplot2::aes(x, y, color = value), pt.size = 3) +
  scatter_layers(
    data = observations[c(2, 4), ],
    mapping = ggplot2::aes(x, y, color = value),
    pt.size = 4, stroke = NULL, outline = TRUE
  ) +
  theme_this()