Rasterise the layers of a plot
Usage
rasterise_plot(
  plot,
  layers = c("Point", "Tile", "Path", "Line", "Segment"),
  dpi = 300,
  dev = "ragg",
  recurse = TRUE
)
Arguments
- plot
A
ggplotorpatchworkobject.- layers
Layer types to rasterise, named without the
Geomprefix, so the default"Point"matchesgeom_point()layers. Add"Violin","Boxplot"or"Crossbar"to rasterise those layers as well.- dpi
Resolution of the rasterised layers, in dots per inch. Default is
300.- dev
Graphic device used to render the rasterised layers, passed to
ggrastr::rasterise(). Default is"ragg", which does not need X11; the"cairo"device of the underlying package does, and is unavailable on many headless machines.- recurse
Whether to rasterise the sub-plots of a
patchworkcomposite. Default isTRUE.
Value
The plot object with its heavy layers rasterised. Objects that are
neither a ggplot nor a patchwork are returned unchanged, with a warning.
Examples
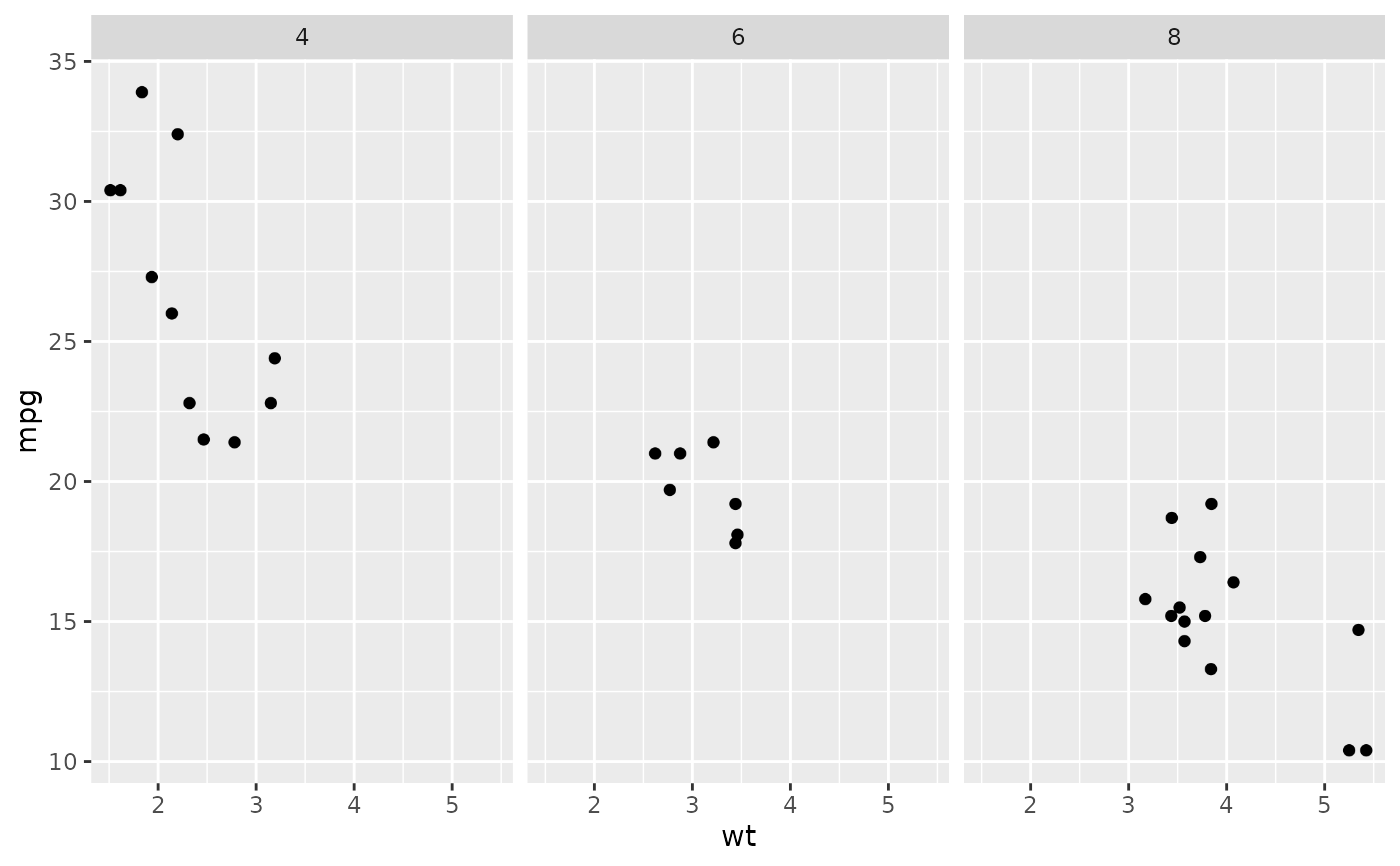
panel <- ggplot2::ggplot(mtcars, ggplot2::aes(wt, mpg)) +
ggplot2::geom_point() +
ggplot2::facet_wrap(~cyl)
rasterise_plot(panel)
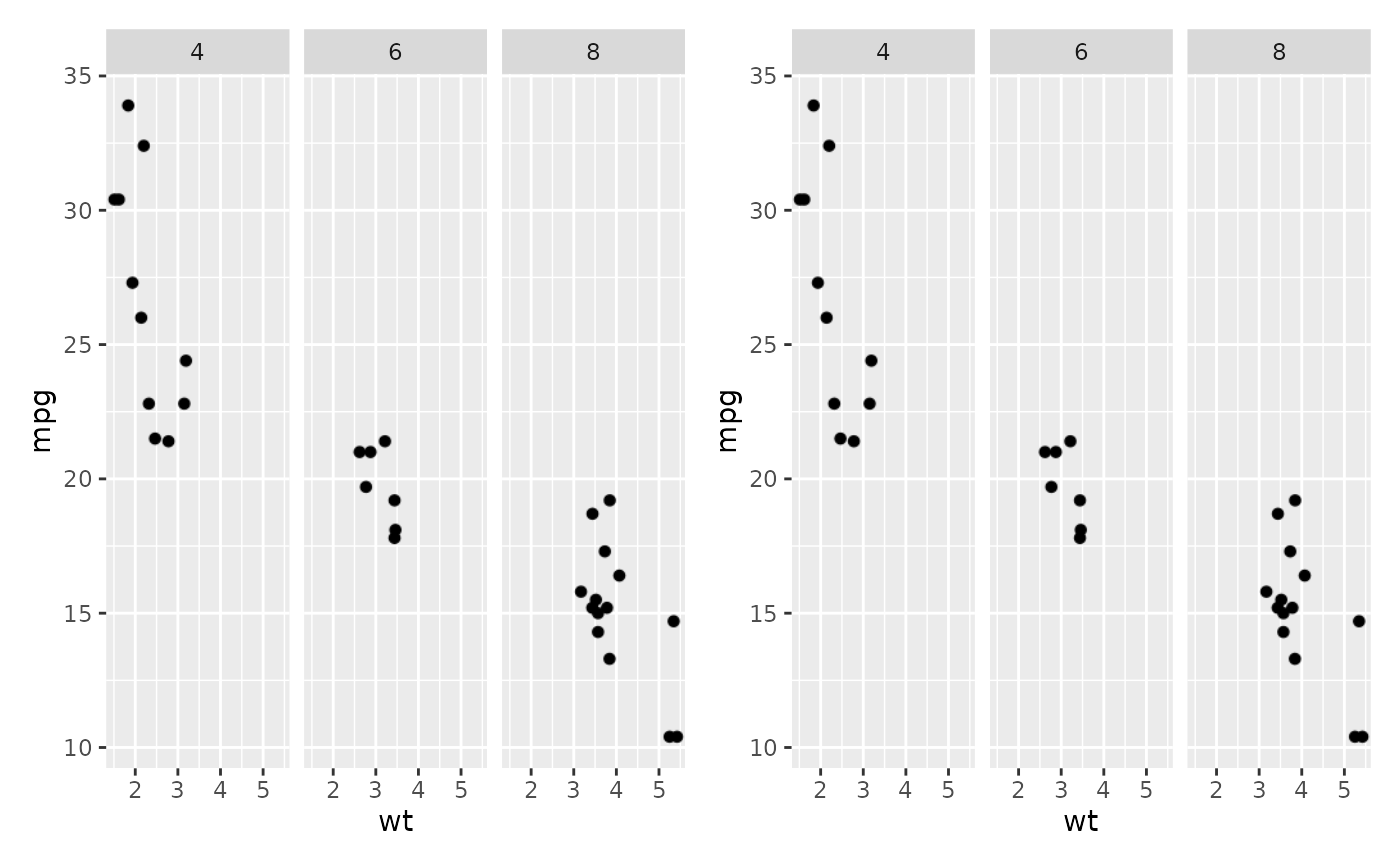
 rasterise_plot(patchwork::wrap_plots(panel, panel), dpi = 150)