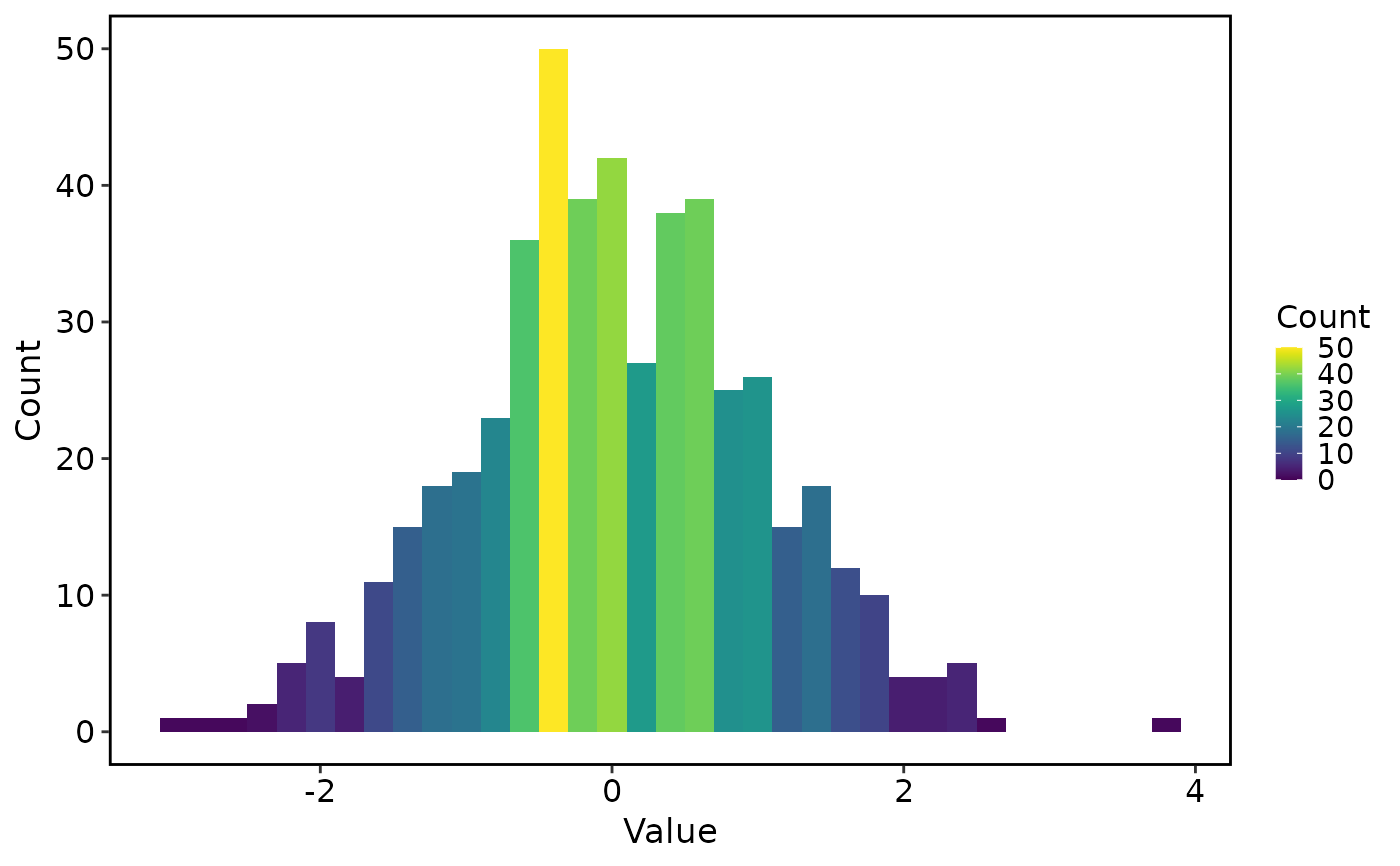
Plot a numeric vector as a histogram with theme_this and thisplot palettes.
Usage
plot_histogram(
  data,
  binwidth = 0.01,
  show_border = FALSE,
  border_color = "black",
  alpha = 1,
  palette = "viridis",
  palcolor = NULL,
  xlab = "Value",
  ylab = "Count",
  legend.position = "right",
  theme_use = "theme_this",
  theme_args = list()
)
Arguments
- data
A numeric vector.
- binwidth
Width of the bins.
- show_border
Whether to show bin borders.
- border_color
Color of the bin borders.
- alpha
Transparency of the bins.
- palette
Palette name used to fill bins by count. See show_palettes.
- palcolor
Custom colors used to create a color palette.
- xlab, ylab
Axis titles.
- legend.position
Legend position.
- theme_use
Theme function applied to the plot.
- theme_args
A named list of arguments passed to
theme_use.