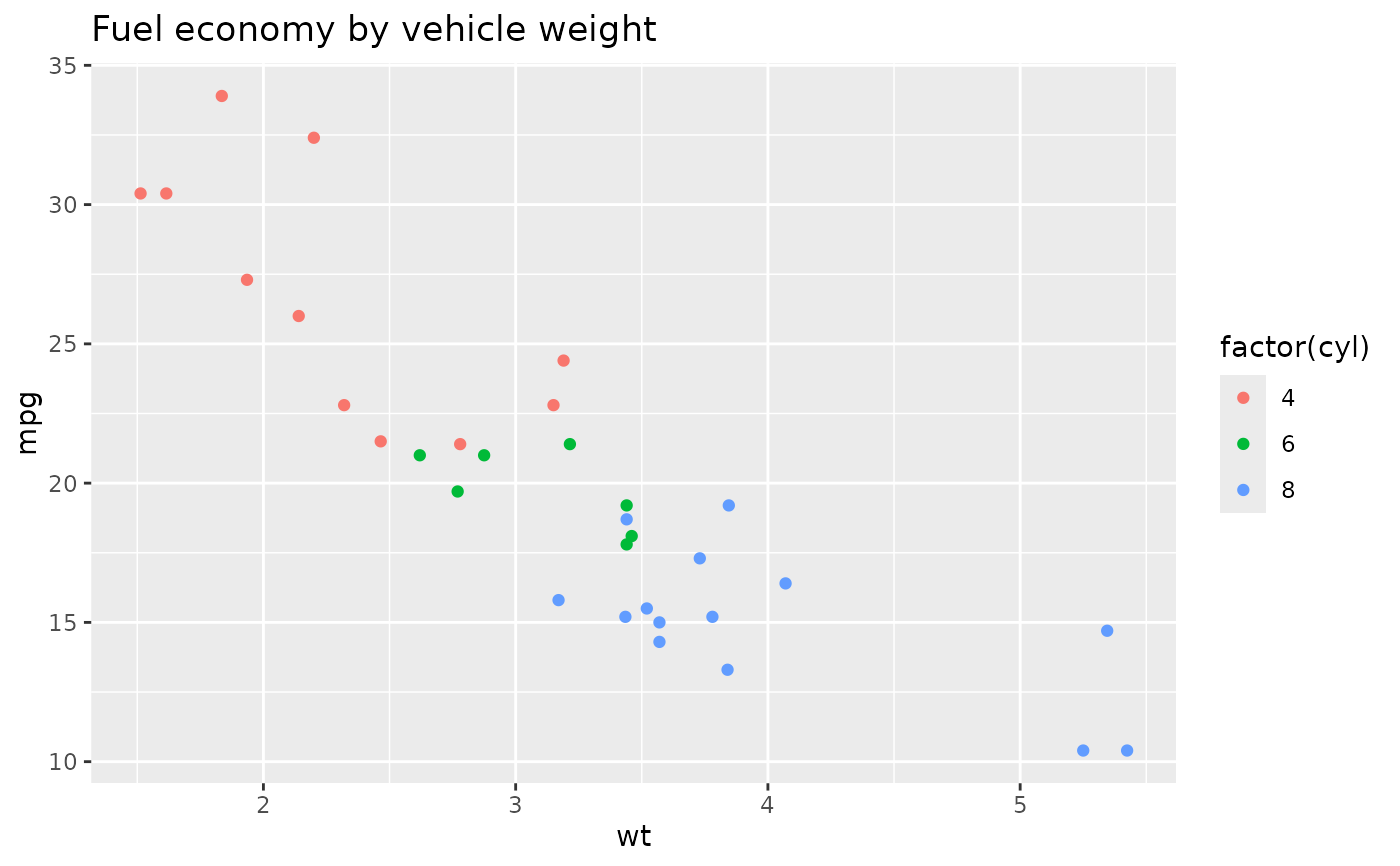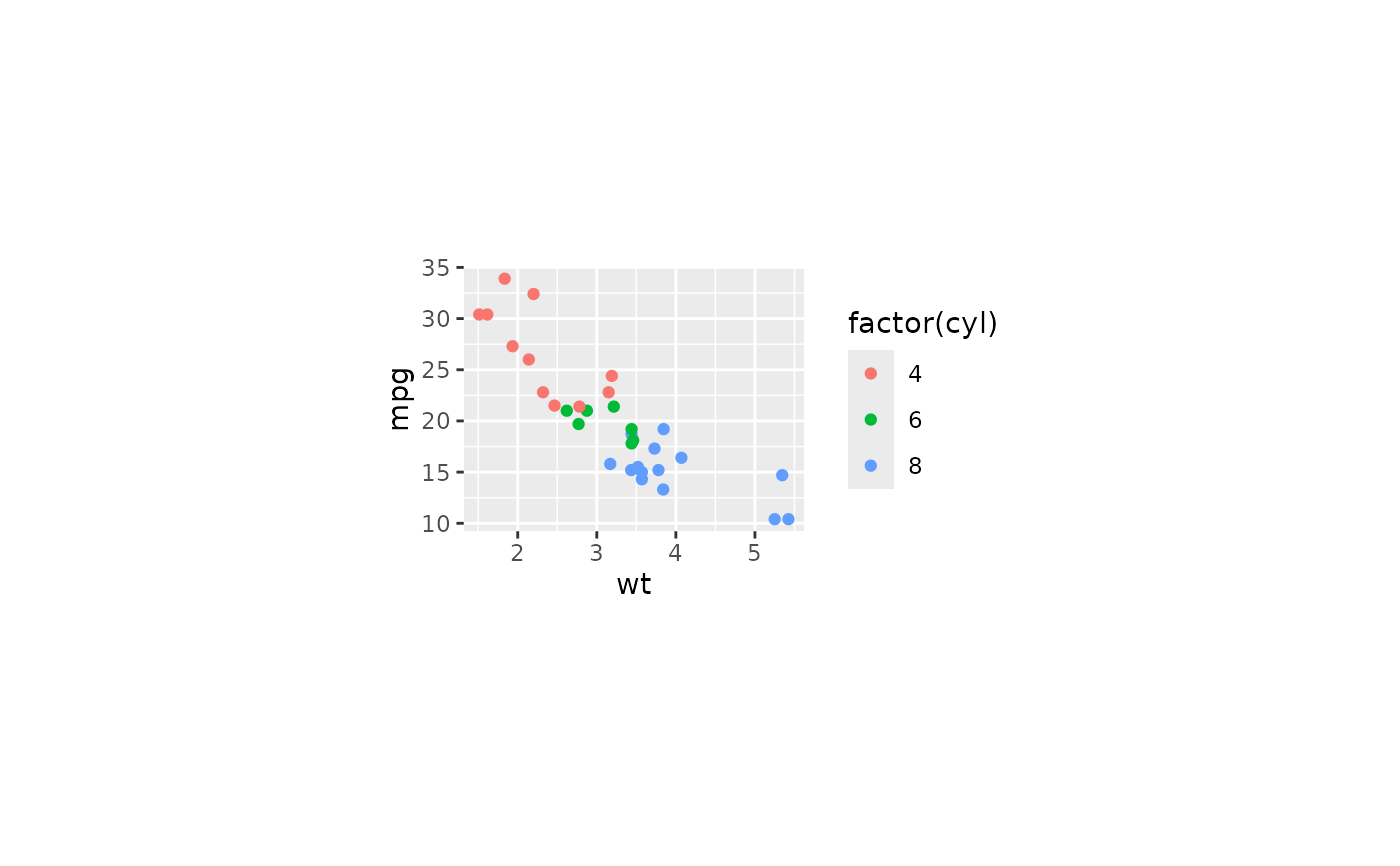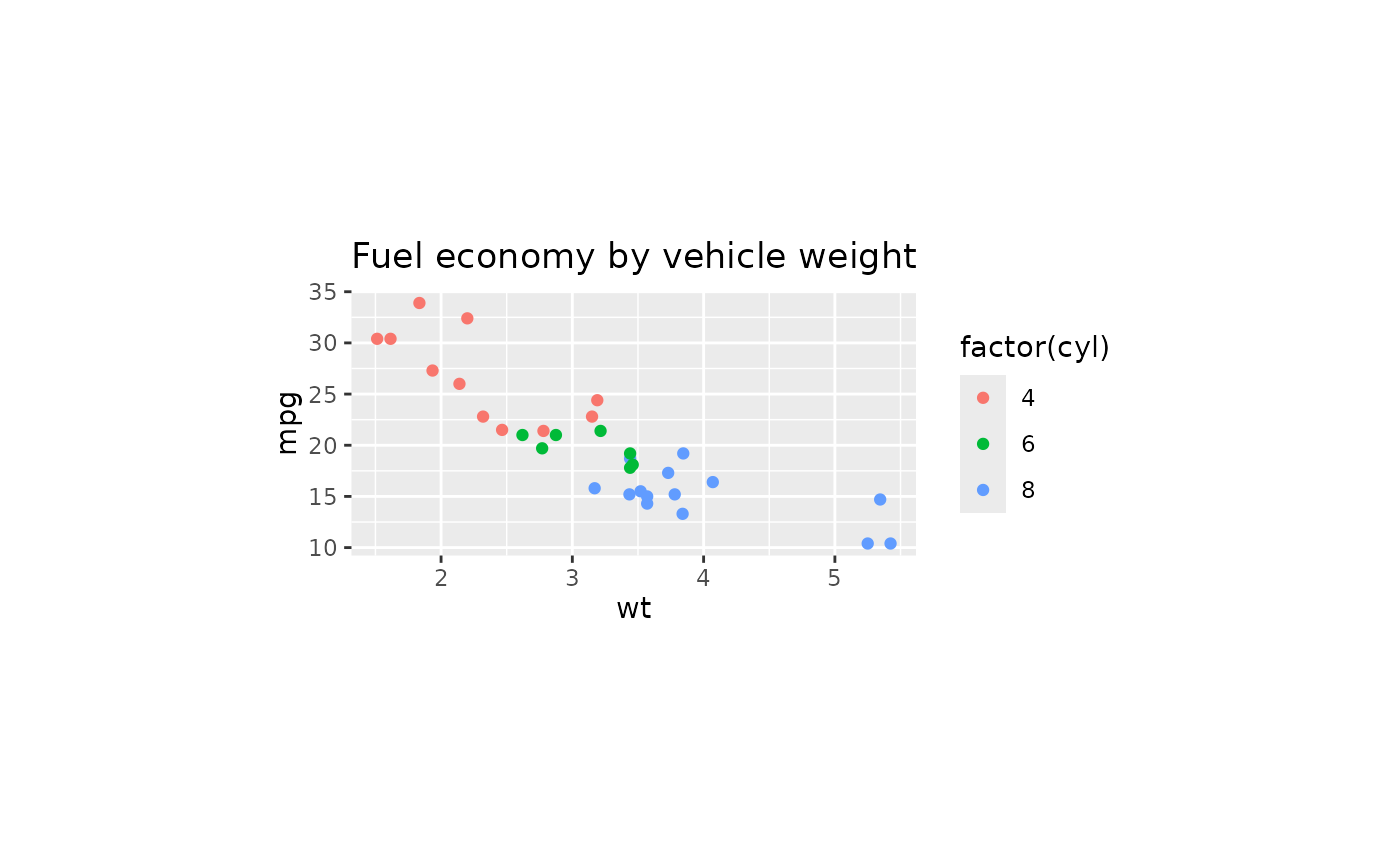
Build a compact plot by choosing a physical panel size and expanding it for
dense in-panel text or overflowing plot labels. A shared point-size baseline
harmonizes ggplot, patchwork, and recorded grid text such as wrapped
ComplexHeatmap output while preserving their relative hierarchy. Constant
data-label text is enlarged conservatively when space permits. The
calculation delegates final layout and saving to
panel_fix() while preserving label content, fixed aspect ratios, patchwork
layouts, and that function's behaviour.
Usage
plot_autosize(
  x,
  panel_width = 45,
  panel_height = 35,
  margin = 2,
  units = "mm",
  save = NULL,
  dpi = 300,
  base_size = "auto",
  label_autosize = TRUE,
  verbose = FALSE
)
Arguments
- x
A ggplot object, grob, or combined plot accepted by
panel_fix().- panel_width, panel_height
Base panel width and height.
- margin
Outer margin.
- units
Units for panel dimensions and margin. See
grid::unit().- save
NULLor a file name to save the fitted plot.- dpi
Resolution used when saving raster output.
- base_size
"auto"to harmonize ggplot and grid text to one inferred base size in points, a positive point size, orNULLto preserve each component's typography.- label_autosize
Whether to enlarge constant
geom_text,geom_label, and ggrepel label sizes when the panel has enough horizontal space.- verbose
Whether to report messages from
panel_fix().
Value
A plot with size and autosize attributes. Ordinary plots are
returned through panel_fix(); wrapped grid content is preserved directly.