Creates a sankey plot which visualize flows between nodes. Each observation needs to have a `x` aesthetic as well as a `next_x` column which declares where that observation should flow. Also each observation should have a `node` and a `next_node` aesthetic which provide information about which group in the y-direction. By default each row of the data frame is counted to calculate the size of flows. A manual flow value can be added with the `value` aesthetic.
Usage
geom_sankey(
  mapping = NULL,
  data = NULL,
  position = "identity",
  na.rm = FALSE,
  show.legend = NA,
  space = NULL,
  type = "sankey",
  width = 0.1,
  smooth = 8,
  inherit.aes = TRUE,
  ...
)
Arguments
- mapping
Provide you own mapping. Both x and y need to be numeric.
- data
Provide you own data.
- position
Change position.
- na.rm
Remove missing values.
- show.legend
Show legend in plot.
- space
Space between nodes in the y-direction.
- type
Either `sankey` or `alluvial`.
- width
Width of nodes.
- smooth
How much smooth should the curve have? More means steeper curve.
- inherit.aes
Should the geom inherit aesthetics.
- ...
Other arguments to be passed to the geom.
Aesthetics
geom_sankey understand the following aesthetics (required aesthetics are in bold):
- **x0** - **y0** - **a** - **b** - **angle** - m1 - m2 - color - fill - size - linetype - alpha - lineend
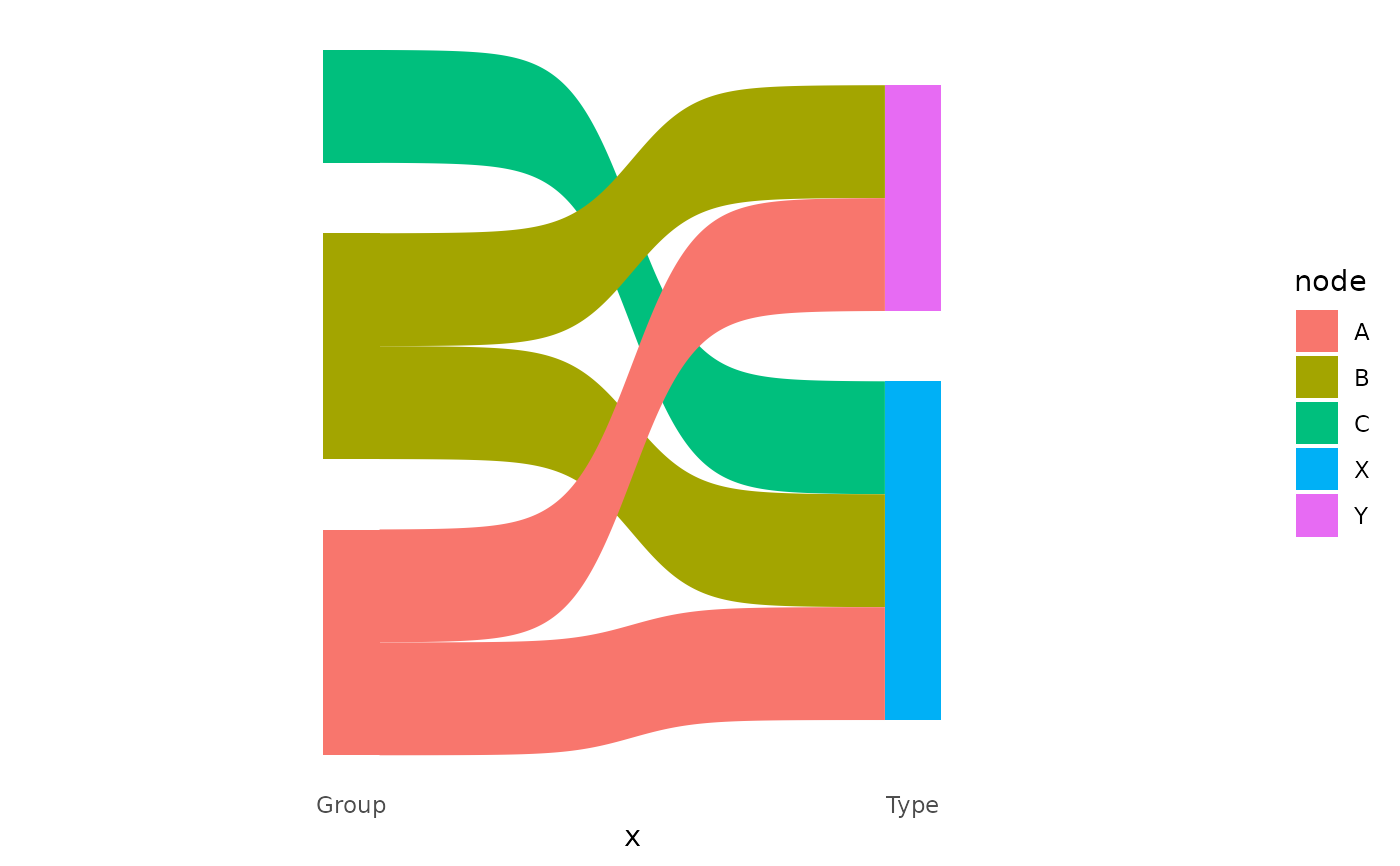
Examples
dat <- data.frame(
  Group = c("A", "A", "B", "B", "C"),
  Type = c("X", "Y", "X", "Y", "X")
)
long <- make_long(dat, Group, Type)
ggplot2::ggplot(
  long,
  ggplot2::aes(
    x = x,
    next_x = next_x,
    node = node,
    next_node = next_node,
    fill = node
  )
) +
  geom_sankey() +
  theme_sankey()