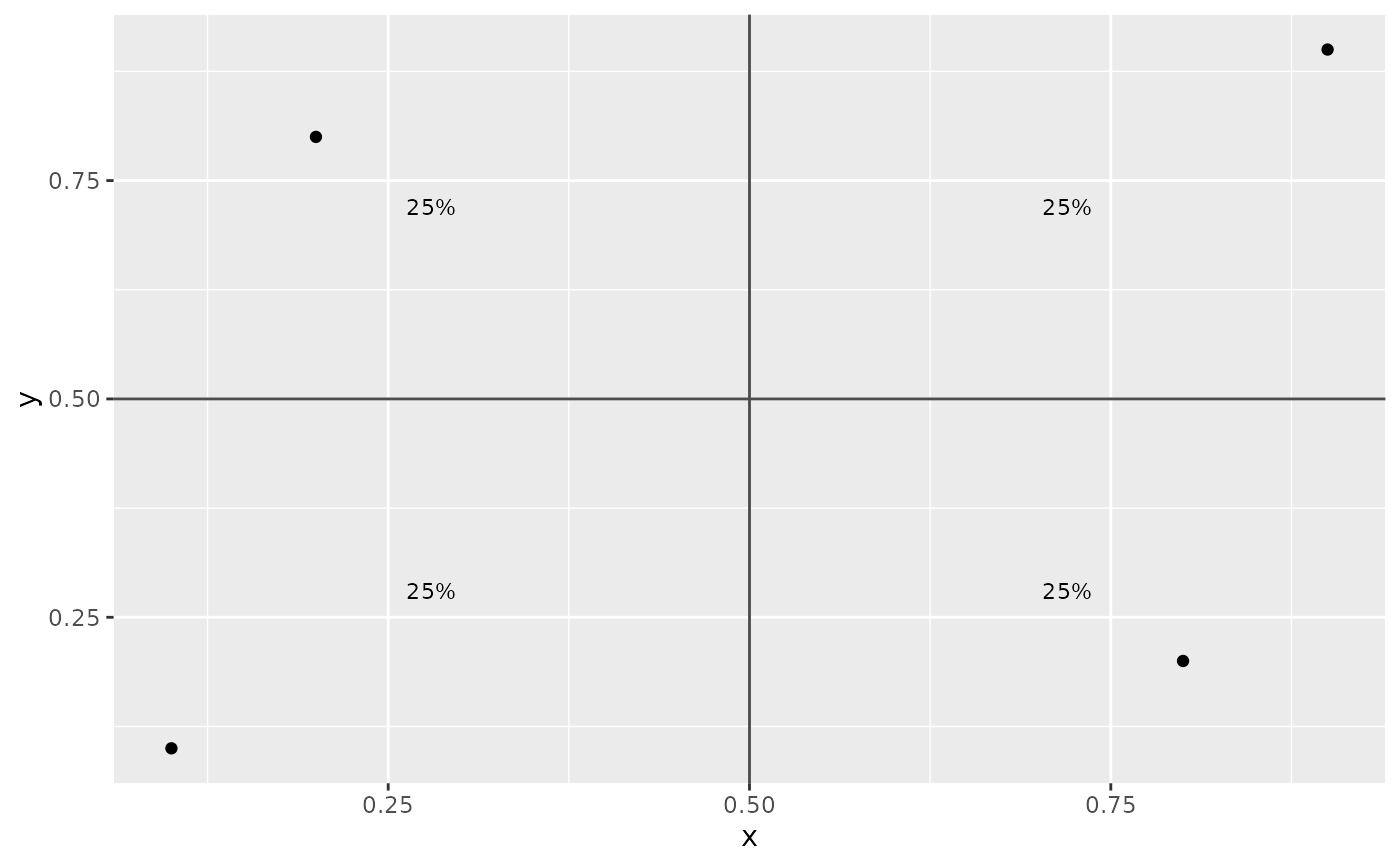
Annotate plot quadrants with percentages
Usage
annotate_quadrants(
  plot,
  x,
  y,
  cutoffs,
  line_color = "grey30",
  line_type = "solid",
  line_width = 0.5,
  label_size = 3,
  group = NULL
)
Arguments
- plot
A `ggplot` object.
- x
Name of the x variable in `plot$data`.
- y
Name of the y variable in `plot$data`.
- cutoffs
Cut points for x and y axes. Can be a numeric vector of length 1 or 2, or a list with the x and y cut points.
- line_color
Quadrant line color.
- line_type
Quadrant line type.
- line_width
Quadrant line width.
- label_size
Label size.
- group
Optional grouping column used to compute percentages within each group.
Examples
df <- data.frame(
x = c(0.1, 0.2, 0.8, 0.9),
y = c(0.1, 0.8, 0.2, 0.9)
)
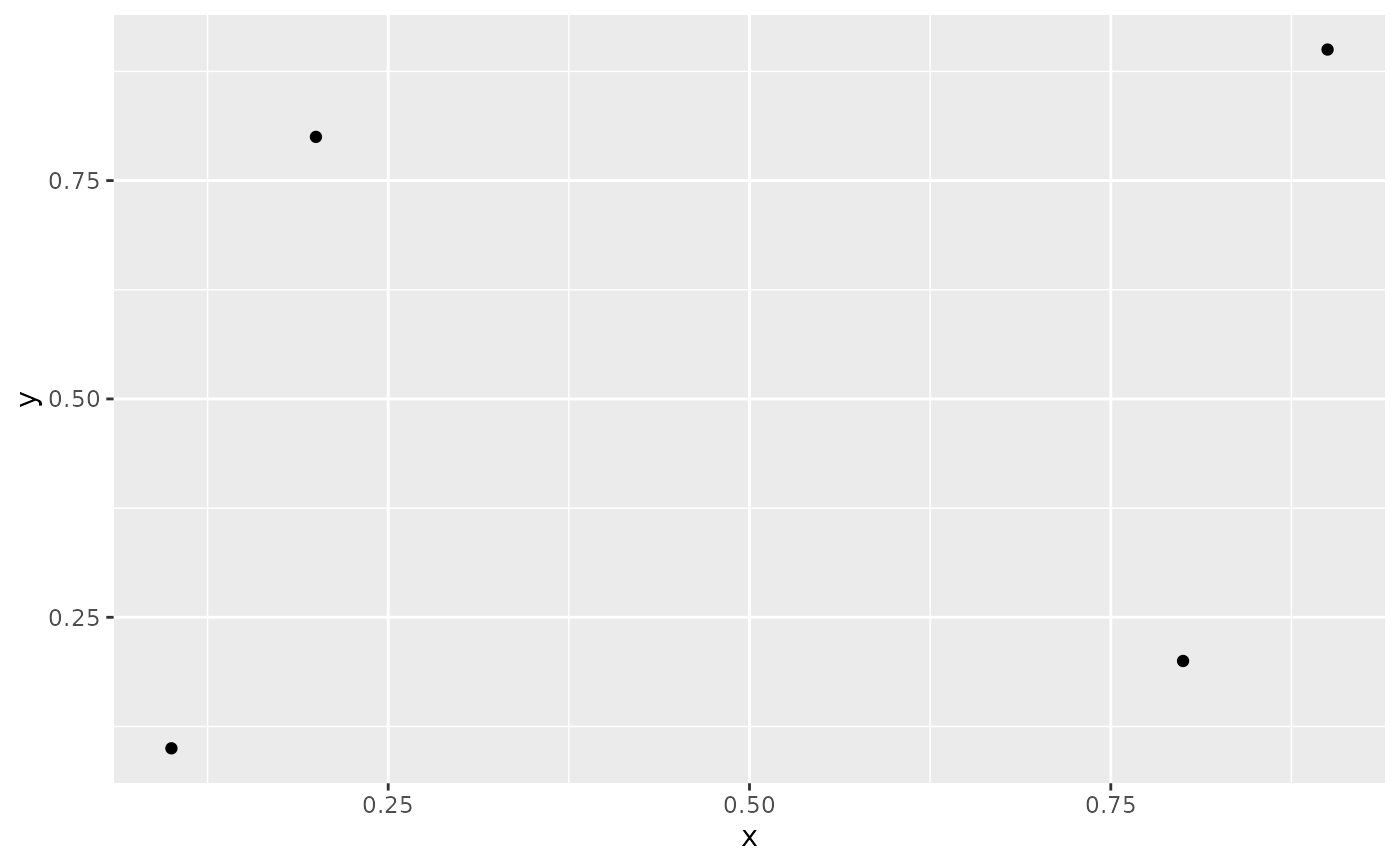
p <- ggplot2::ggplot(df, ggplot2::aes(x = x, y = y)) +
ggplot2::geom_point()
p
 annotate_quadrants(p, x = "x", y = "y", cutoffs = 0.5)