Visualize observations on precomputed two-dimensional coordinates.
Usage
DimDataPlot(
  data,
  x,
  y,
  group.by = NULL,
  split.by = NULL,
  shape.by = NULL,
  show_na = FALSE,
  palette = "Chinese",
  palcolor = NULL,
  NA_color = "grey80",
  pt.size = 2,
  pt.alpha = 1,
  shape.values = NULL,
  add_mark = FALSE,
  mark_type = c("hull", "ellipse", "rect", "circle"),
  mark_expand = grid::unit(3, "mm"),
  mark_alpha = 0.1,
  mark_linetype = 1,
  label = FALSE,
  label.size = 4,
  label.fg = "black",
  label.bg = "white",
  label.bg.r = 0.1,
  label_repel = FALSE,
  label_repulsion = 20,
  label_point_size = 1,
  label_point_color = "black",
  label_segment_color = "black",
  add_origin = FALSE,
  origin.color = "grey30",
  origin.linetype = "dashed",
  origin.linewidth = 0.4,
  aspect.ratio = 1,
  title = NULL,
  subtitle = NULL,
  xlab = NULL,
  ylab = NULL,
  legend.position = "right",
  legend.direction = "vertical",
  legend.title = NULL,
  theme_use = "theme_this",
  theme_args = list(),
  seed = 11
)
Arguments
- data
A data frame containing coordinates and optional grouping columns.
- x
Name of the column used as the x-axis coordinate.
- y
Name of the column used as the y-axis coordinate.
- group.by
Name of the column used to color observations. Default is
NULL.- split.by
Name of the column used to split the plot into facets. Default is
NULL.- shape.by
Name of the column used to map point shapes. Default is
NULL.- show_na
Whether to keep missing values in
group.by,split.by, orshape.byas an explicit"NA"level. Default isFALSE.- palette
Color palette name. Available palettes can be found in show_palettes. Default is
"Chinese".- palcolor
Custom colors used to create a color palette. Default is
NULL.- NA_color
Color used for missing values.
- pt.size
Point size.
- pt.alpha
Point transparency.
- shape.values
Point shapes used when
shape.byis set.- add_mark
Whether to add marks around groups. Default is
FALSE.- mark_type
Type of mark to add around groups. One of
"hull","ellipse","rect", or"circle". Default is"hull"."ellipse"uses ggplot2::stat_ellipse withtype = "norm"andlevel = 0.95; the other mark types use ggforce marks.- mark_expand
Expansion of the mark around each group. This is used for
"hull","rect", and"circle"marks. Default isgrid::unit(3, "mm").- mark_alpha
Transparency of the mark. Default is
0.1.- mark_linetype
Line type of the mark border. Default is
1.- label
Whether to label group centers.
- label.size
Size of labels.
- label.fg
Foreground color of labels.
- label.bg
Background color of labels.
- label.bg.r
Background ratio of labels.
- label_repel
Whether labels repel from their group centers.
- label_repulsion
Repulsion force for labels.
- label_point_size
Size of center points for repelled labels.
- label_point_color
Color of center points for repelled labels.
- label_segment_color
Color of label segments.
- add_origin
Whether to add dashed x = 0 and y = 0 reference lines.
- origin.color
Color of origin reference lines.
- origin.linetype
Line type of origin reference lines.
- origin.linewidth
Line width of origin reference lines.
- aspect.ratio
Aspect ratio passed to
theme().- title
Plot title.
- subtitle
Plot subtitle.
- xlab
Label for the x axis.
- ylab
Label for the y axis.
- legend.position
Position of the legend.
- legend.direction
Direction of the legend.
- legend.title
Title of the group legend.
- theme_use
Theme function applied to the plot.
- theme_args
A named list of arguments passed to
theme_use.- seed
Random seed.
Examples
set.seed(1)
plot_data <- data.frame(
x = c(rnorm(40, -1), rnorm(40, 1)),
y = c(rnorm(40, 0), rnorm(40, 1)),
group = rep(c("A", "B"), each = 40)
)
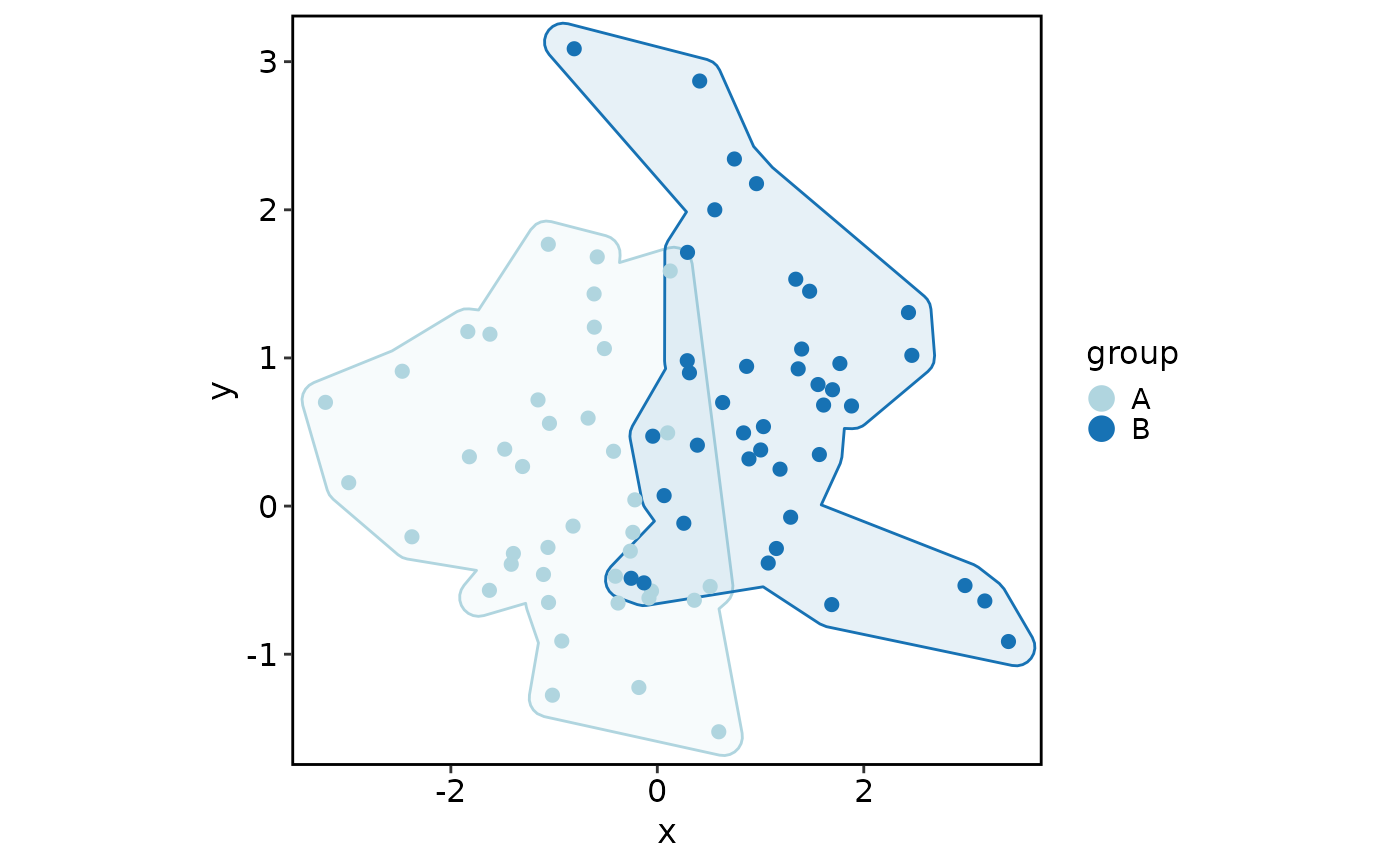
DimDataPlot(
plot_data,
x = "x",
y = "y",
group.by = "group"
)
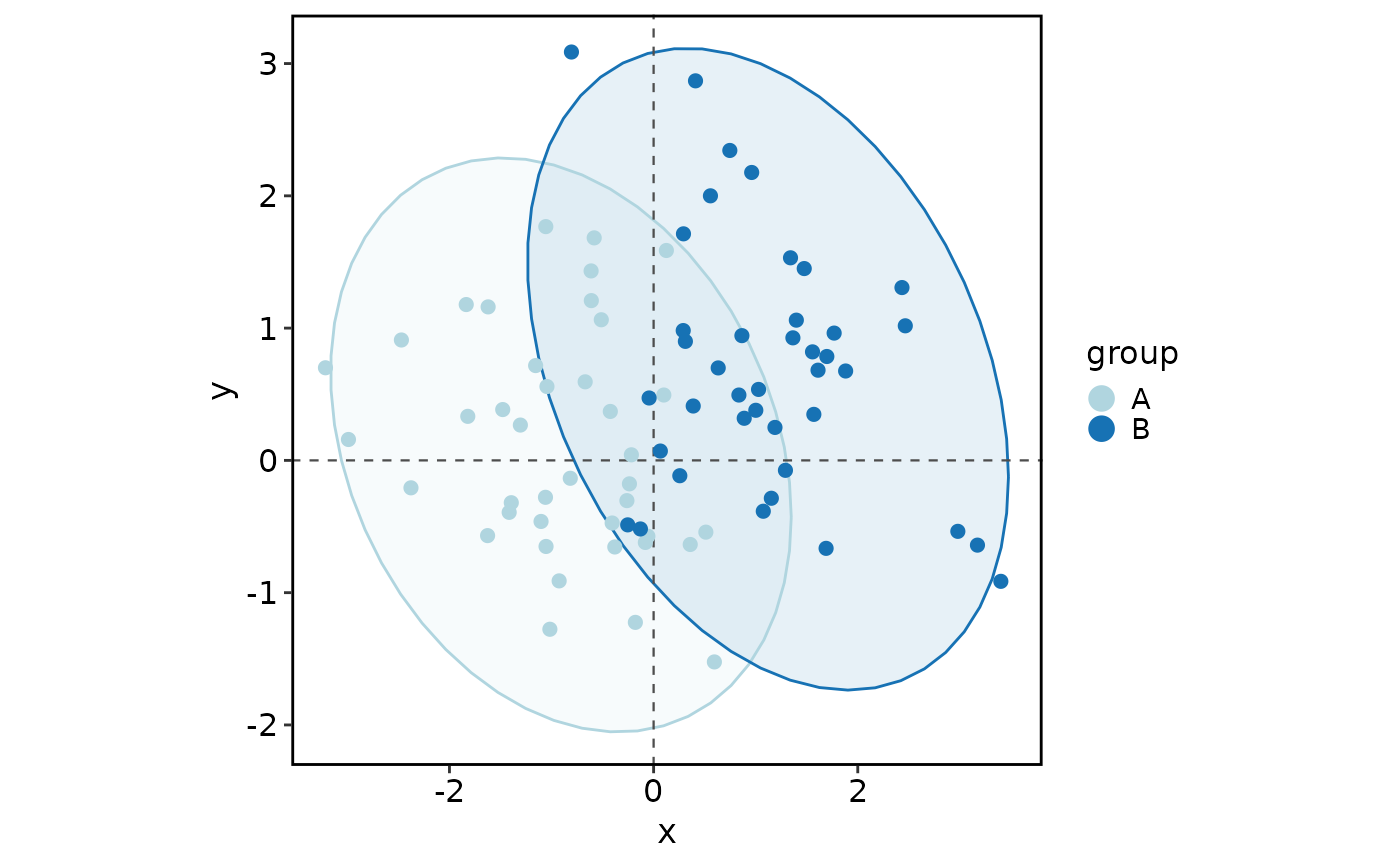
 DimDataPlot(
plot_data,
x = "x",
y = "y",
group.by = "group",
add_origin = TRUE,
mark_type = "ellipse"
)
DimDataPlot(
plot_data,
x = "x",
y = "y",
group.by = "group",
add_origin = TRUE,
mark_type = "ellipse"
)
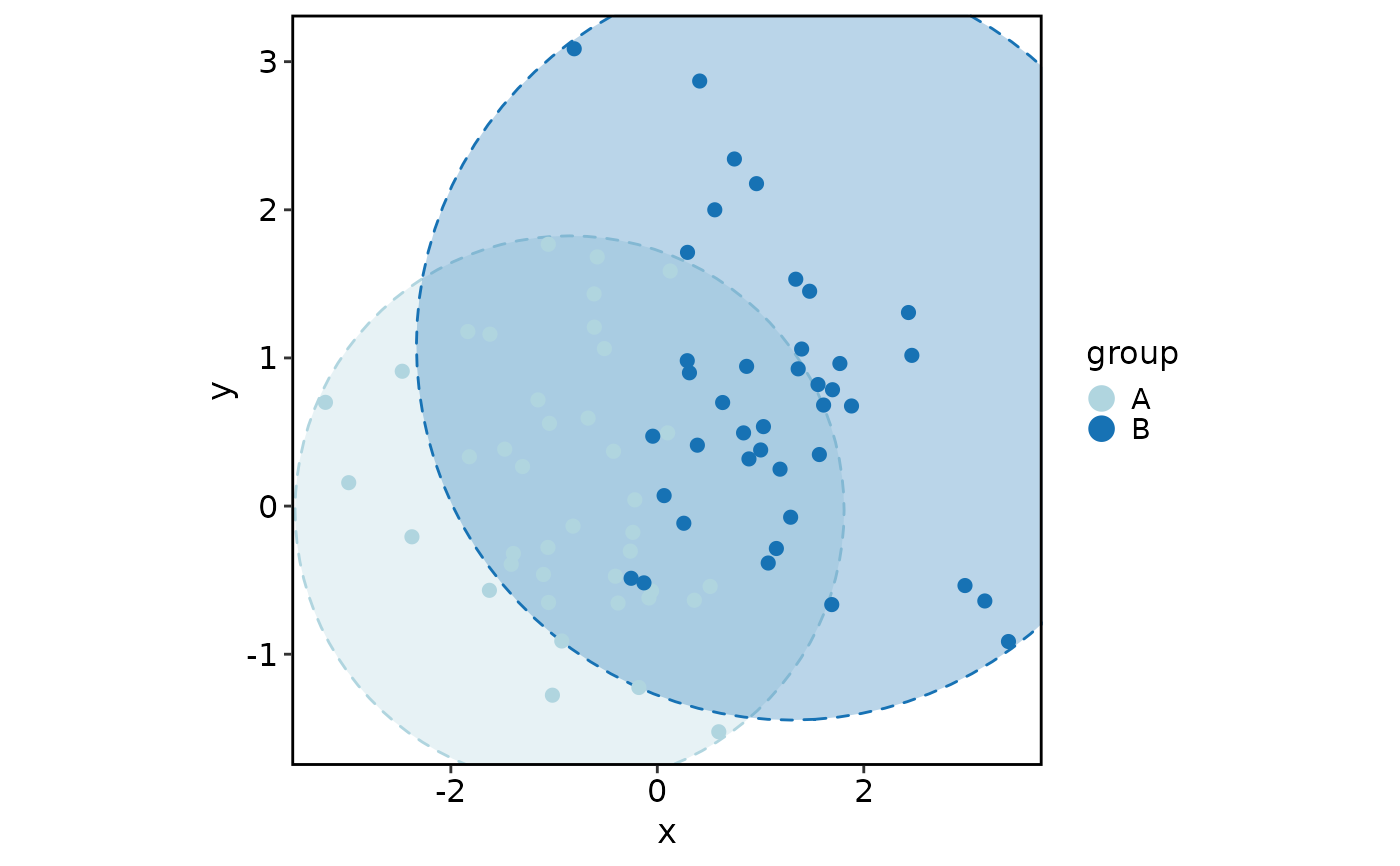
 DimDataPlot(
plot_data,
x = "x",
y = "y",
group.by = "group",
mark_type = "circle",
mark_alpha = 0.3,
mark_expand = grid::unit(1, "mm"),
mark_linetype = 2
)
DimDataPlot(
plot_data,
x = "x",
y = "y",
group.by = "group",
mark_type = "circle",
mark_alpha = 0.3,
mark_expand = grid::unit(1, "mm"),
mark_linetype = 2
)